Getting Started
CandleKit is a SwiftUI package that draws interactive candlestick charts — the kind you'd see in a trading app — and makes them feel like a native iOS control instead of a custom-drawn widget bolted onto your screen. Drag to scroll with momentum, pinch to zoom around your fingers, long-press for a crosshair, double-tap to reset, and everything adapts automatically to dark mode, Dynamic Type and VoiceOver. It ships with a library of technical indicators (moving averages, RSI, MACD, Bollinger Bands and more) and a full set of drawing tools (trend lines, Fibonacci retracements, rectangles and more) that traders expect from a "real" charting app.
You don't need to know anything about candlestick charts to get started — just an array of price
bars and a CandlestickChart view.
Installation
CandleKit is distributed as a Swift Package.
In Xcode
- Choose File › Add Package Dependencies…
- Paste the repository URL:
https://github.com/LalanaChami/CandleKit.git - Pick a version rule and add the package to your app target.
In Package.swift
dependencies: [
    .package(url: "https://github.com/LalanaChami/CandleKit.git", from: "1.0.0")
]
CandleKit is still moving fast, so check the repo's latest release tag
for the actual version number to pin — the 1.0.0 above is just a placeholder.
Then add "CandleKit" to your target's dependencies:
.target(
    name: "YourApp",
    dependencies: ["CandleKit"]
)
CandleKit requires iOS 17 or later and Swift 6. If you only need the underlying math (indicators,
scales, viewport logic) without any SwiftUI, you can depend on CandleKitCore alone — it's pure
Foundation and even builds on Linux.
Your first chart
Here's the smallest possible working example. CandleSampleData.randomWalk(count:), from
CandleKitCore, generates a deterministic fake price series so you can see something on screen
immediately, without wiring up a real data feed first.
import CandleKit
import SwiftUI

struct ContentView: View {
    let candles = CandleSampleData.randomWalk(count: 200)

    var body: some View {
        CandlestickChart(candles)
            .indicators([.sma(20), .ema(50)])
            .frame(height: 360)
            .padding()
    }
}
What you'll see
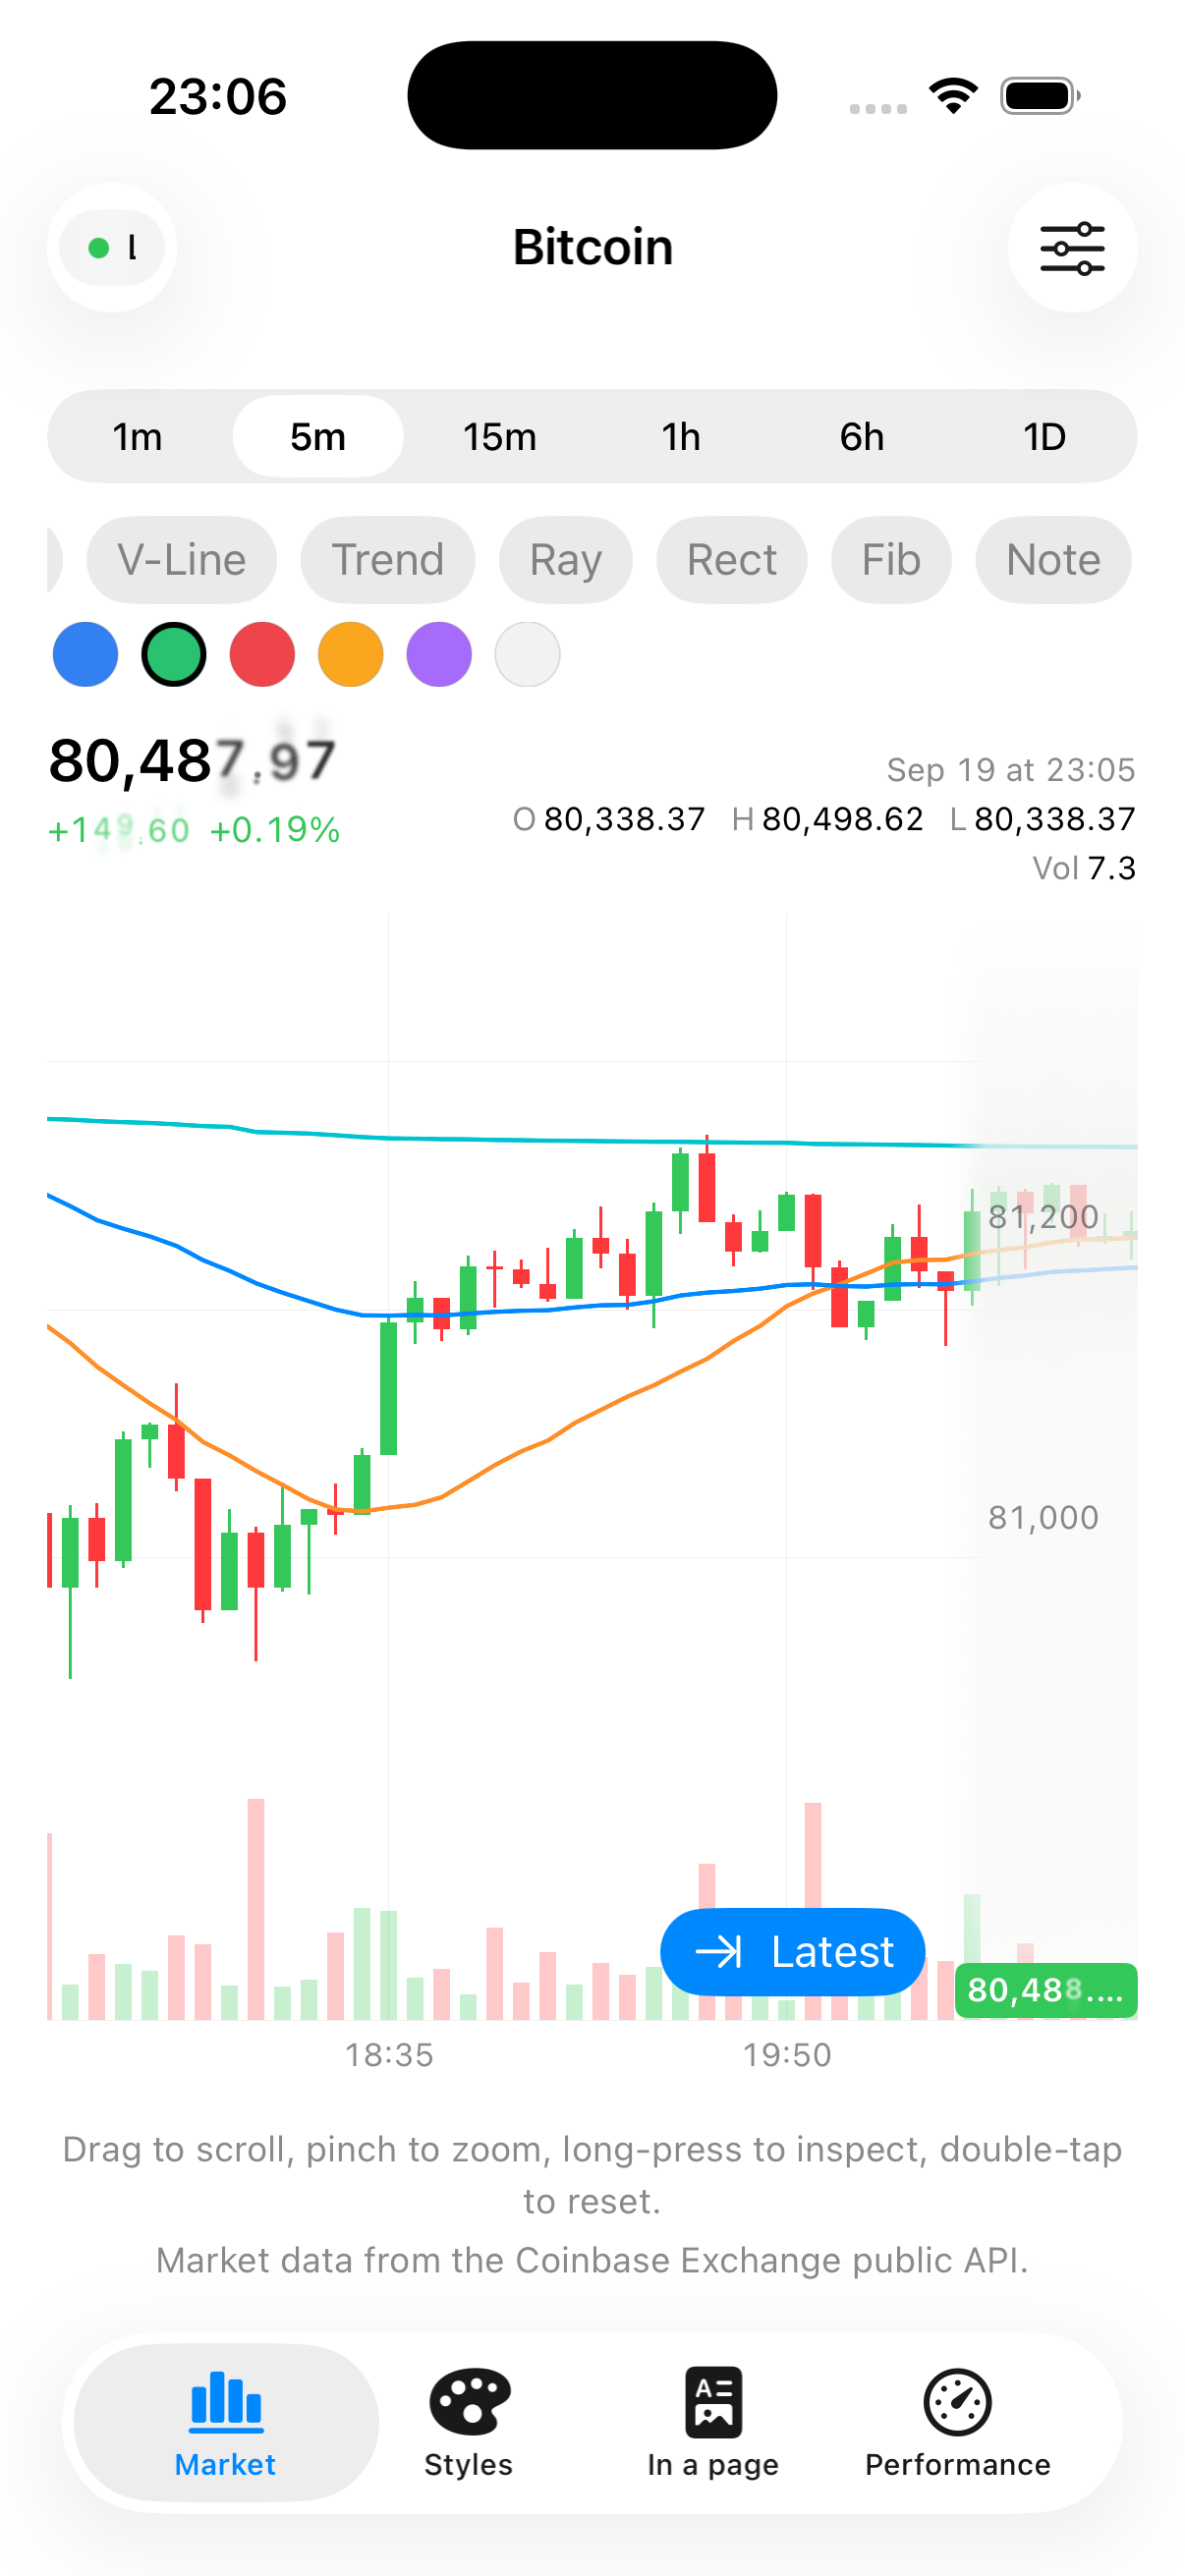
A scrollable, zoomable candlestick chart with a 20-period simple moving average (blue), a 50-period exponential moving average (orange), and volume bars underneath — all from a handful of lines of SwiftUI.
Everything is a plain SwiftUI View. There's no UIViewControllerRepresentable to fight with, no
delegate protocols to implement — just modifiers, the same way you'd style any other view.
Where to go next
- Candles & the viewport — the
Candlemodel, sort order, and how live updates and history-loading actually work under the hood. - Indicators — every built-in indicator CandleKit ships, and how to write your own.
- Drawing tools — trend lines, Fibonacci retracements and the rest of the trader annotation toolkit, including two flagship "trader-UX" touches worth seeing.
- Styling —
CandleChartStyle, the built-in presets, and how to build your own look. - Gestures & the crosshair — what the built-in gestures do and how to hook into them.
- API Reference — the full reference for every public type.