Indicators
Indicators are the lines, bands and oscillator panes traders overlay on top of raw price — moving averages, Bollinger Bands, RSI, and so on. CandleKit ships a large built-in library, computes them efficiently (results are cached and only recomputed when your data actually changes), and lets you toggle them on and off from your own UI.
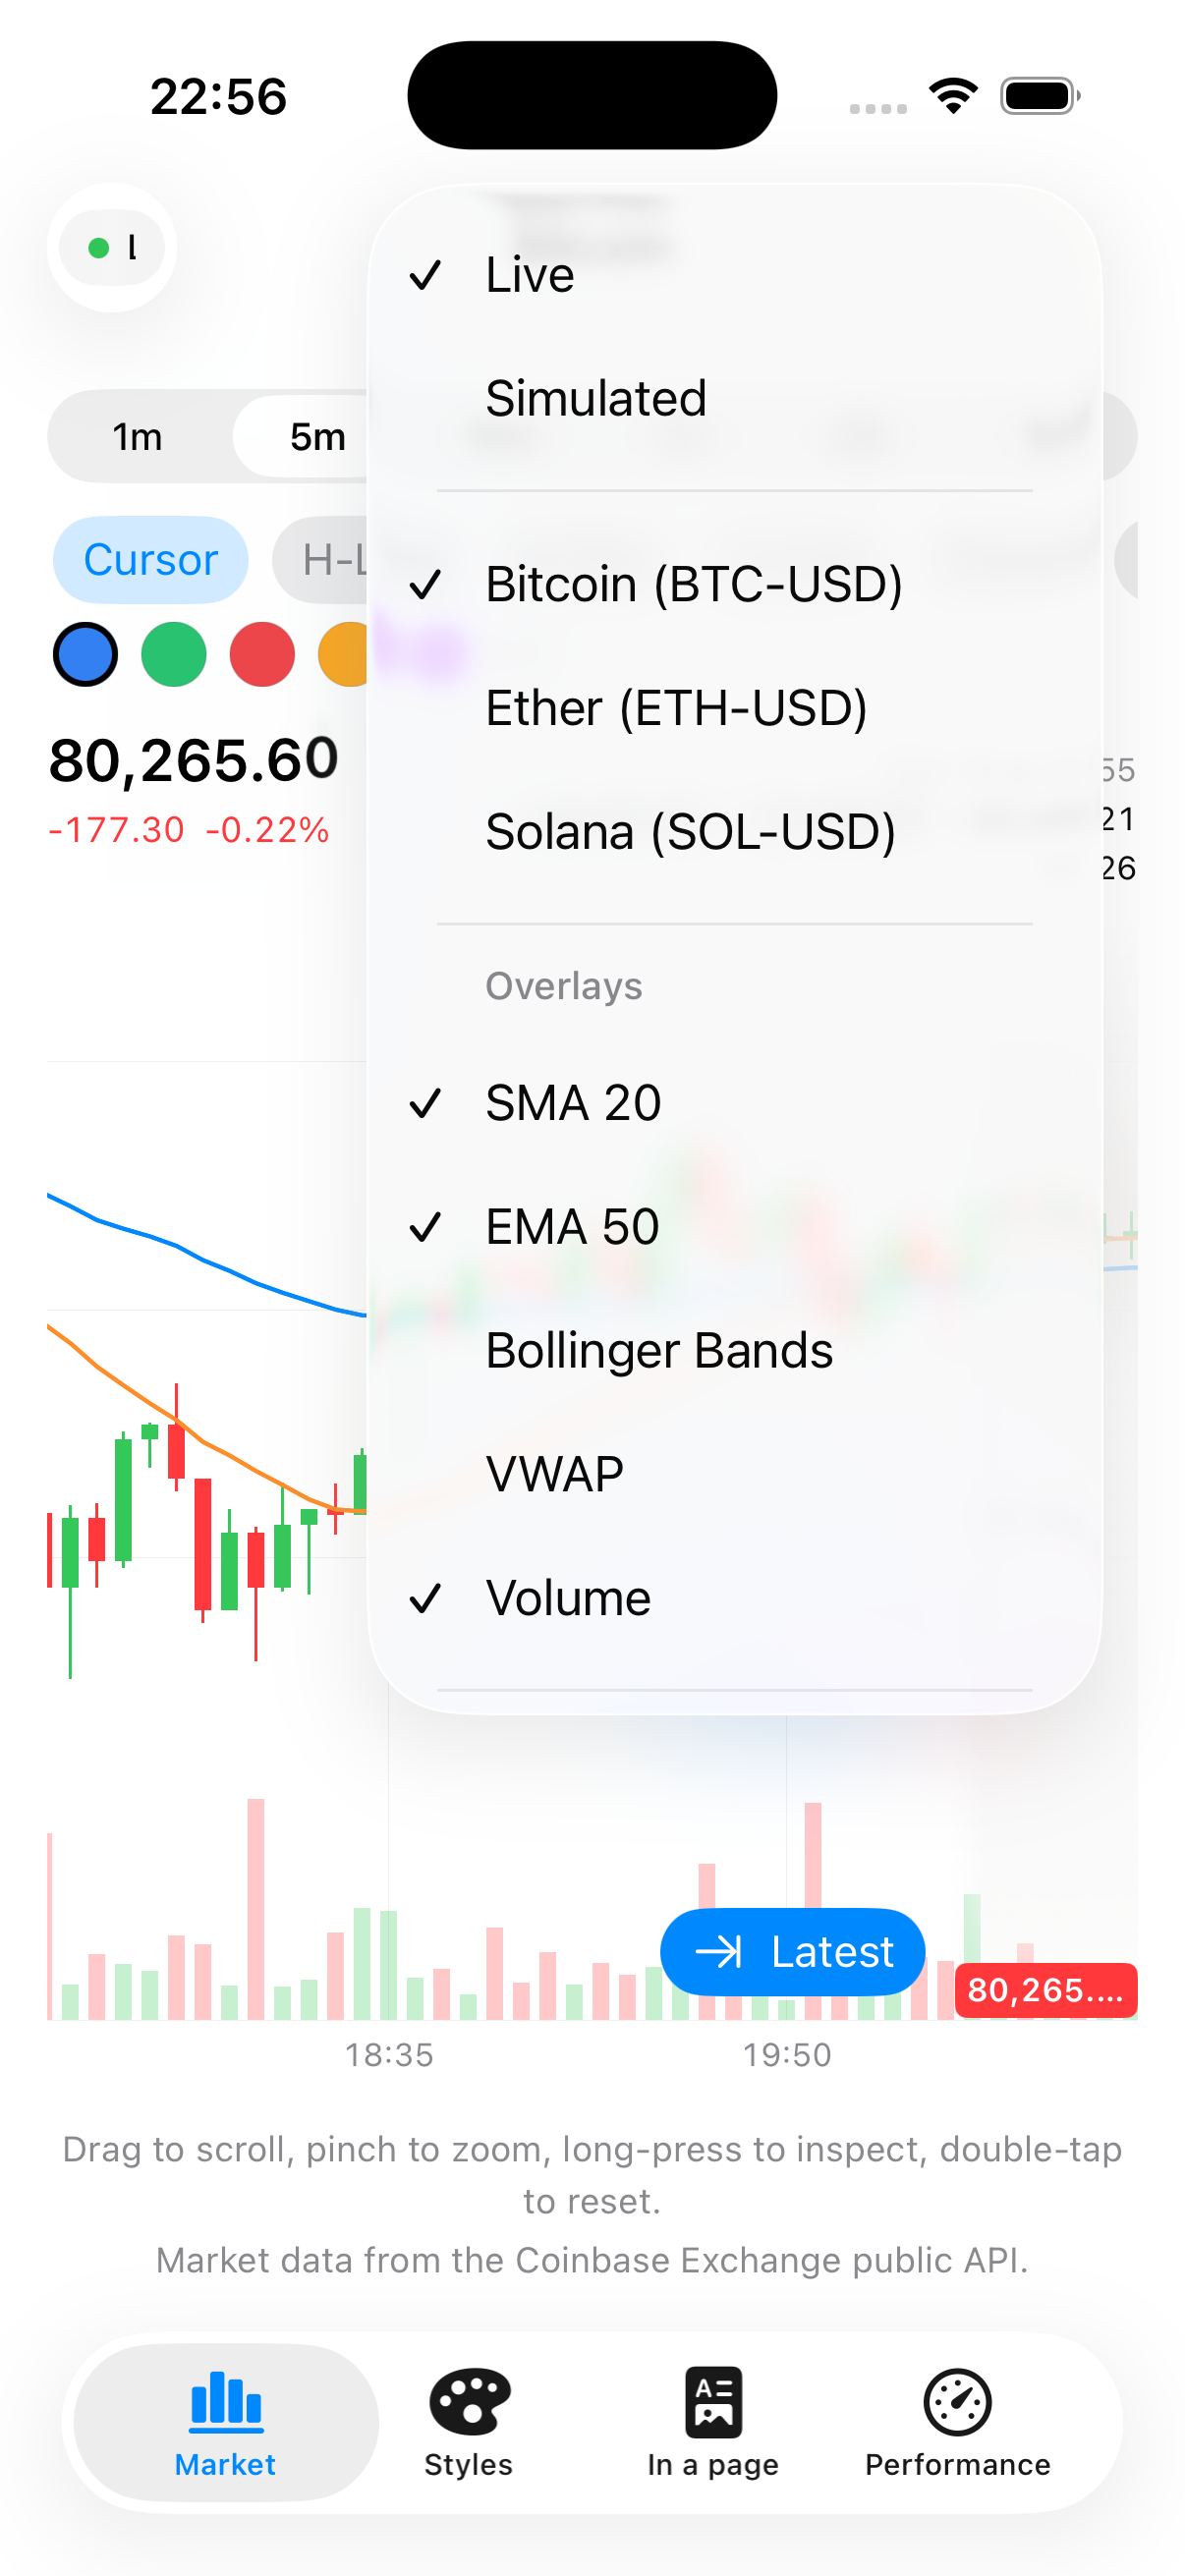
The .indicators(...) modifier
Attach a list of ChartIndicator values to your chart:
CandlestickChart(candles)
    .indicators([.sma(20), .ema(50, color: .blue)])
Each ChartIndicator wraps something conforming to the Indicator protocol, plus optional color
and line-width overrides:
public struct ChartIndicator: Identifiable {
    public var indicator: any Indicator
    public var colors: [Color]      // empty = use the chart style's palette
    public var lineWidth: CGFloat?  // nil = each plot's own width
    public var isVisible: Bool      // hide without losing configuration
}
Toggling isVisible (or just leaving an indicator out of the array) is cheap — CandleKit only
computes indicators that are actually visible, so a settings screen with a dozen possible overlays
doesn't pay for the ones a user has turned off.
Built-in indicators
Every indicator below is available as a static factory method on ChartIndicator, so you rarely
need to construct the underlying Indicator type yourself.
Moving averages (price overlay)
| Factory | What it draws |
|---|---|
.sma(_ period:, color:, lineWidth:) | Simple moving average of the close. |
.ema(_ period:, color:, lineWidth:) | Exponential moving average — reacts faster to recent price than SMA. |
.wma(_ period:, color:, lineWidth:) | Weighted moving average — weights recent candles more heavily than SMA, less aggressively than EMA. |
.indicators([.sma(20), .ema(50, color: .blue), .wma(10)])
Volatility
| Factory | What it draws |
|---|---|
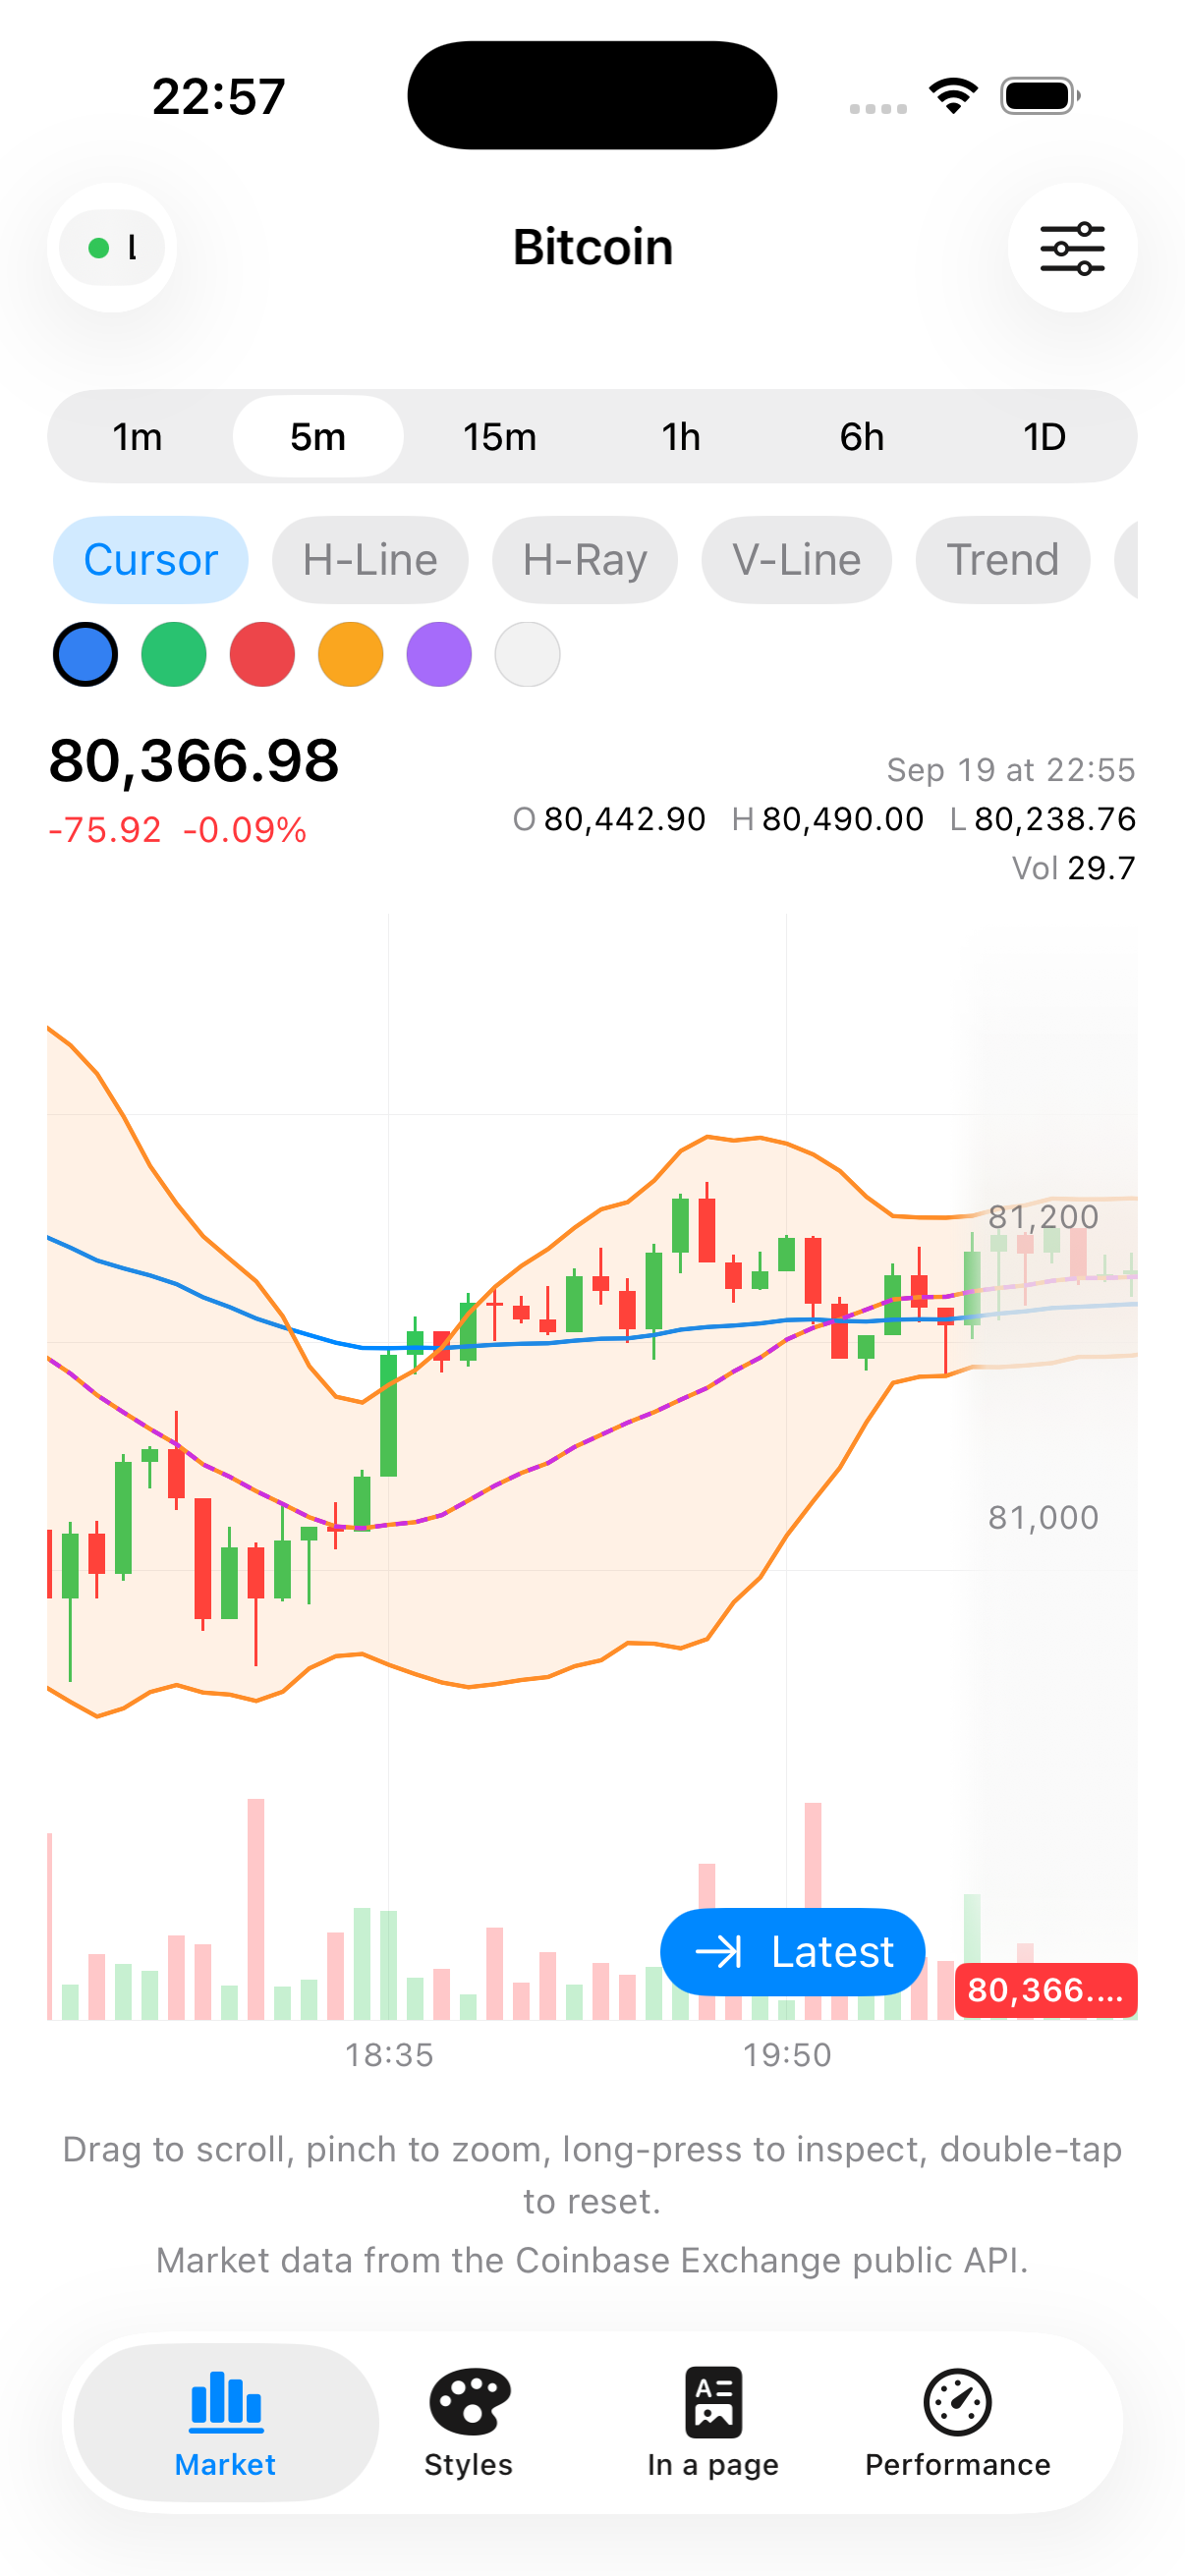
.bollingerBands(period:multiplier:) | An SMA with upper/lower bands a number of standard deviations away, and a shaded channel between them. |
.atr(_ period:) | Average True Range, in its own pane below the price. |
.indicators([.bollingerBands(period: 20, multiplier: 2)])
Oscillators (separate pane)
| Factory | What it draws |
|---|---|
.rsi(_ period:) | Wilder's Relative Strength Index, on a fixed 0–100 pane with overbought/oversold reference levels. |
.macd(fast:slow:signal:) | MACD: two lines plus a signed histogram. |
.stochastic(period:smoothK:smoothD:) | Stochastic oscillator, %K and %D lines. |
.adx(_ period:) | ADX / DMI trend-strength oscillator. |
.cci(_ period:) | Commodity Channel Index. |
.williamsR(_ period:) | Williams %R. |
.rateOfChange(period:mode:) | Rate of Change (percentage or plain momentum, depending on mode). |
.indicators([.rsi(14), .macd()])
Volume-based
| Factory | What it draws |
|---|---|
.vwap() | Volume-Weighted Average Price, overlaid on the price. |
.obv() | On-Balance Volume, in its own pane. |
.mfi(_ period:) | Money Flow Index. |
.chaikinMoneyFlow(_ period:) | Chaikin Money Flow. |
.indicators([.vwap(), .obv()])
Trend / channel overlays
| Factory | What it draws |
|---|---|
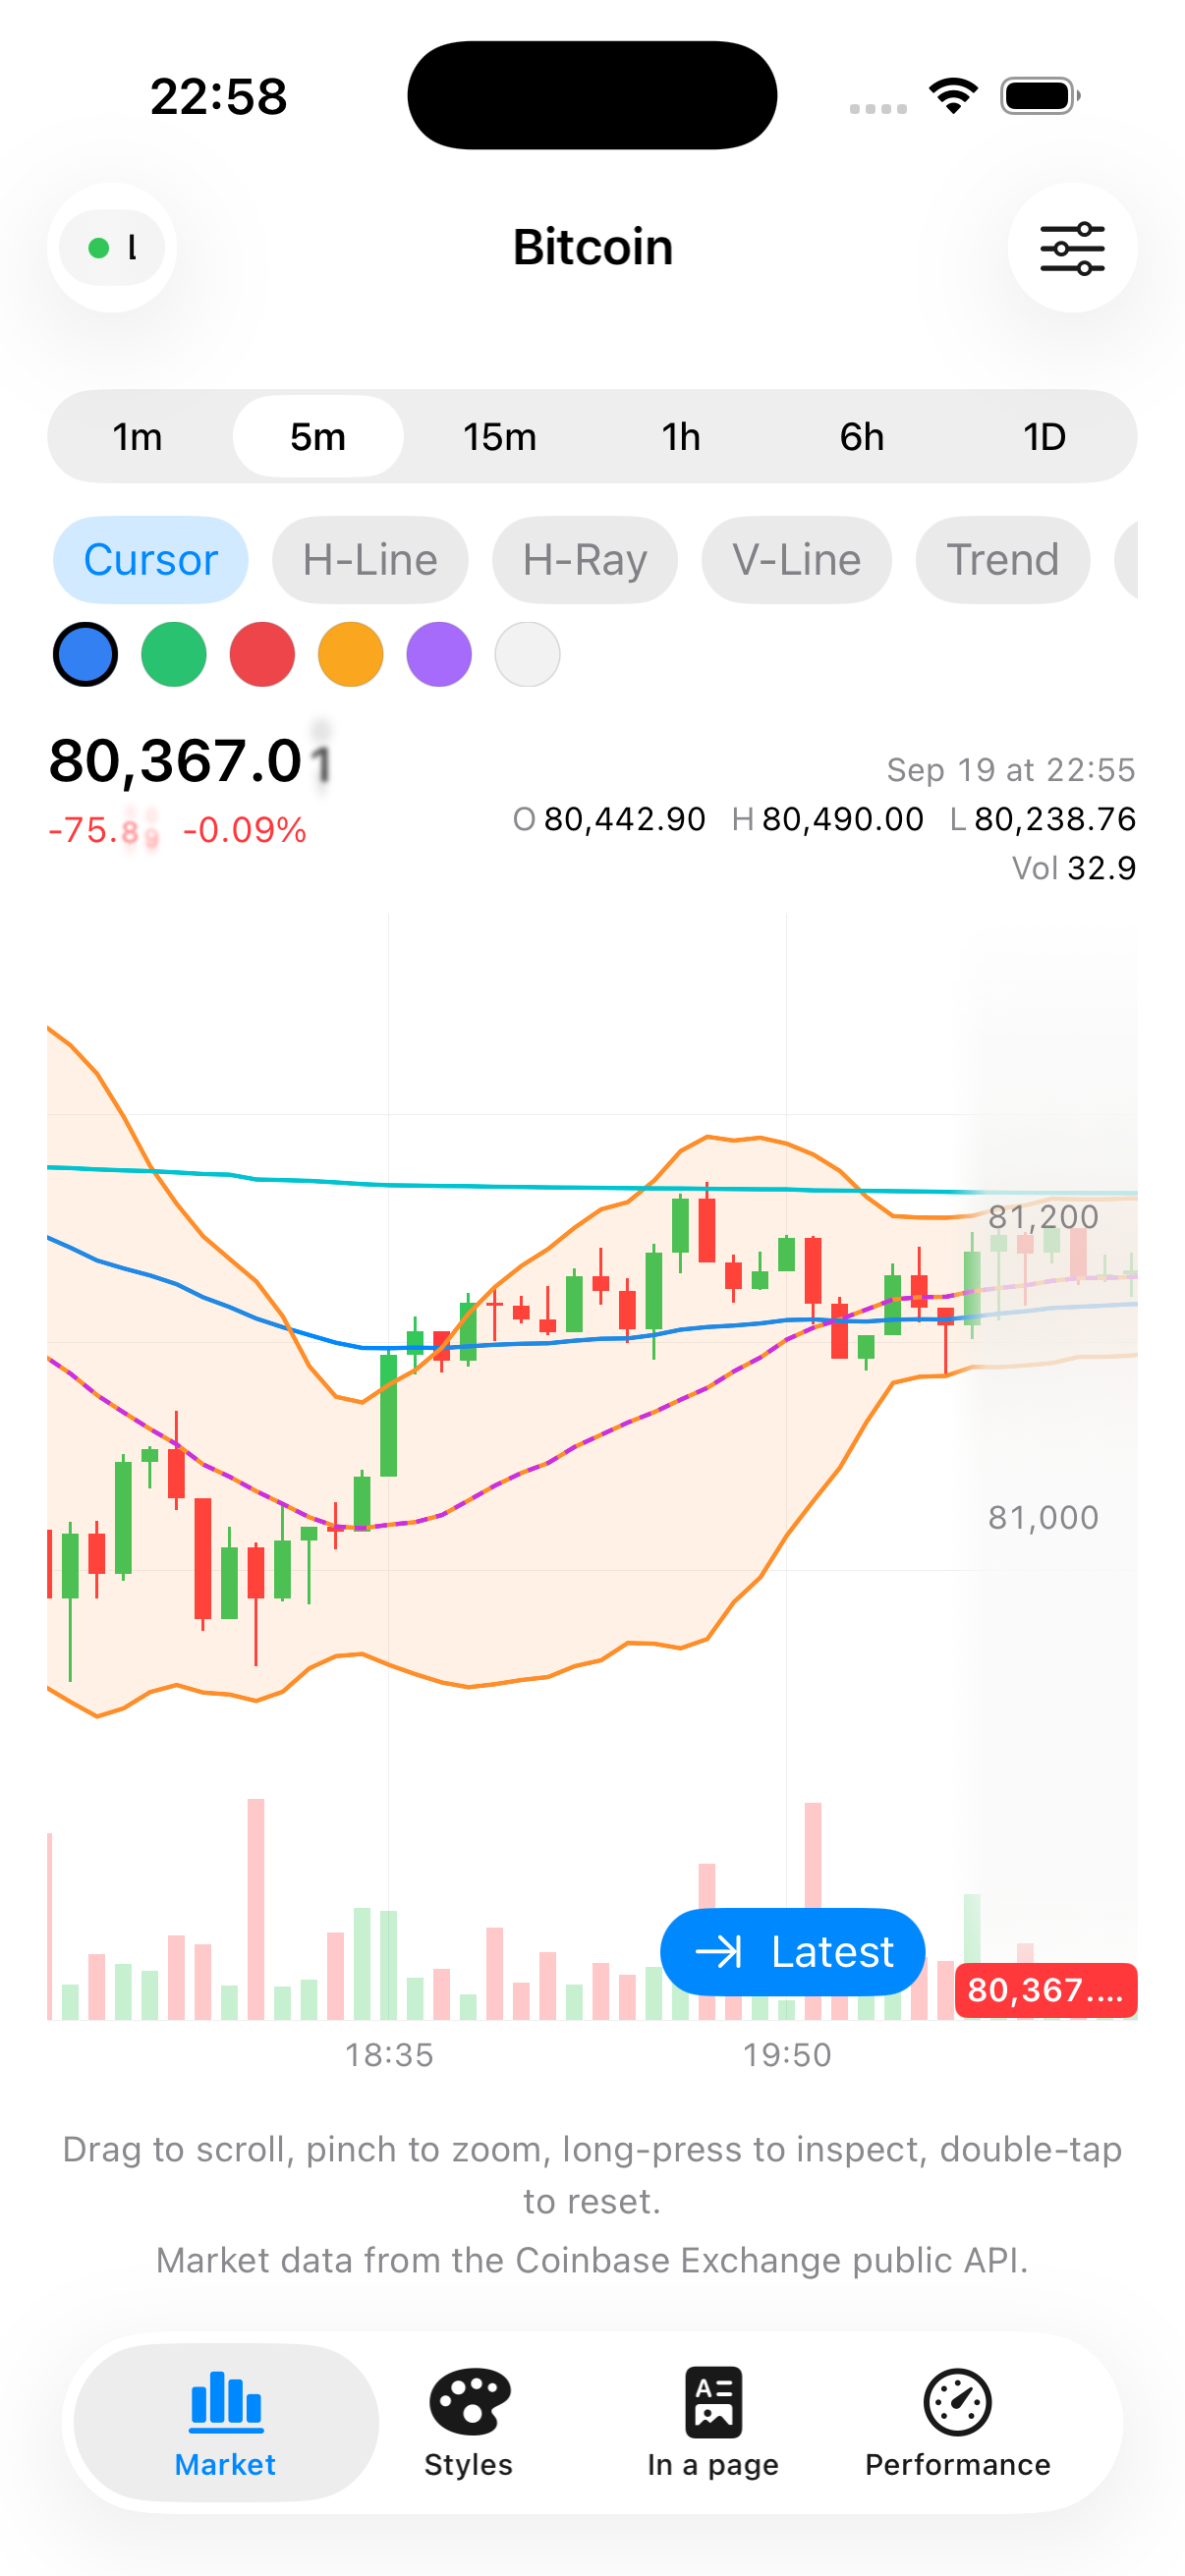
.donchianChannels(period:) | Highest-high / lowest-low channel. |
.keltnerChannels(period:atrPeriod:multiplier:) | ATR-based channel around an average. |
.superTrend(period:multiplier:) | SuperTrend flip-line. |
.parabolicSAR(step:maximum:) | Parabolic SAR dots. |
.ichimokuCloud(conversionPeriod:basePeriod:spanBPeriod:displacement:) | The full Ichimoku Cloud system. |
.pivotPoints(method:) | Classic (or other) pivot point levels. |
.indicators([.superTrend(), .parabolicSAR()])
Every factory has sensible defaults, so .rsi() (with no arguments) and .rsi(14) do the same
thing — pass a value only when you want something other than the standard period.
Writing your own indicator
If CandleKit doesn't ship the indicator you need, conform your own type to the Indicator
protocol and wrap it in a ChartIndicator:
struct RangeIndicator: Indicator {
    static let identifier = "range"
    static let displayName = "High − Low"
    static let category = IndicatorCategory.volatility

    var parameters: [IndicatorParameter] = []
    var pane: IndicatorPane { .separate() }
    var shortLabel: String { "Range" }

    func compute(_ candles: [Candle]) -> IndicatorResult {
        IndicatorResult(plots: [
            IndicatorPlot(key: "range", name: "Range", values: candles.map { $0.high - $0.low })
        ])
    }
}

CandlestickChart(candles)
    .indicators([ChartIndicator(RangeIndicator())])
compute(_:) runs whenever your candle data changes (not on every animation frame), so an O(n)
implementation is plenty fast even on a long series — but it's worth avoiding an accidental
O(n·period) loop for anything with a configurable lookback period.
If you want your indicator to show up in a searchable, categorized picker UI alongside CandleKit's
own indicators, register it in an IndicatorCatalog — see the
ChartIndicator API reference for the full Indicator protocol and catalog
API.