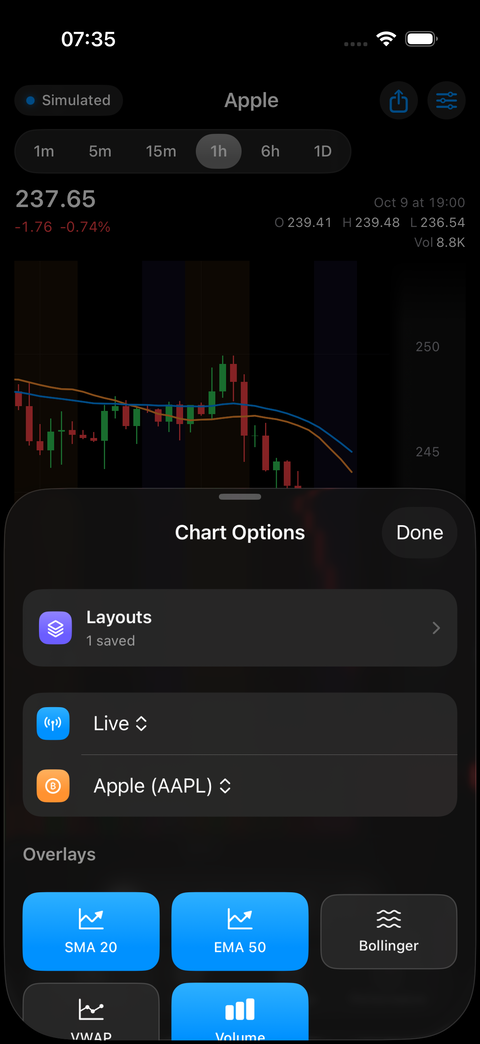
Comparison & Session Shading
Comparing instruments
.comparing(_:normalization:) plots other instruments over the chart, re-basing the price axis to percent change (or an index starting at 100 with .indexed100).
CandlestickChart(appleCandles)
    .comparing([
        ComparisonSeries(name: "MSFT", candles: microsoftCandles),
        ComparisonSeries(name: "SPY", candles: indexCandles, color: .gray),
    ])
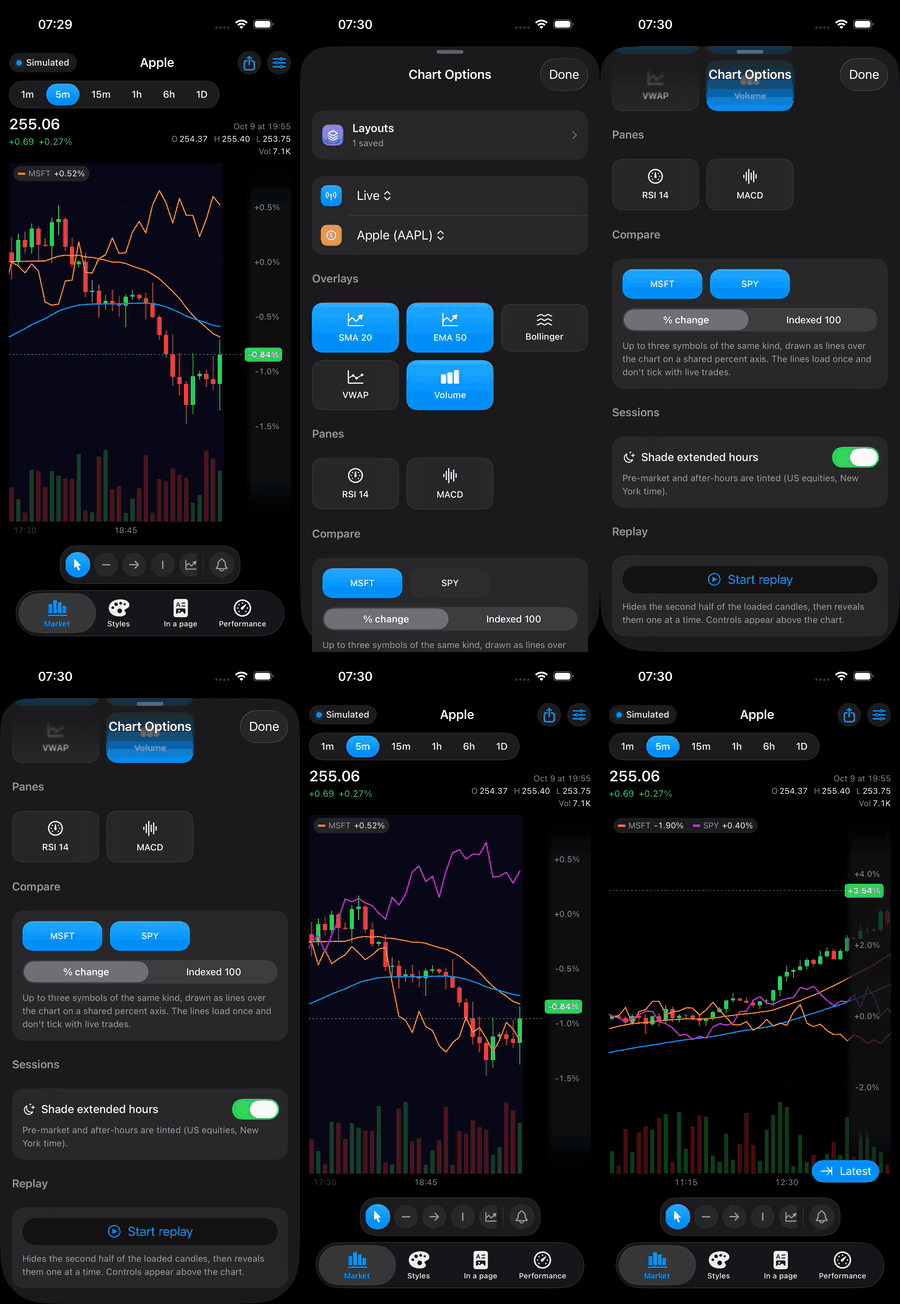
The series don't need the same candle times: each chart candle uses the latest close at or before it. A legend in the top-left follows the crosshair. In the Demo, open Chart Options → Compare.
Session shading
.tradingSessions(_:) tints pre-market, after-hours and overnight candles. TradingSession.usEquities covers US equities in America/New_York; build your own TradingSession values for other markets. Sessions apply to series of one hour or shorter.
CandlestickChart(candles).tradingSessions(TradingSession.usEquities)
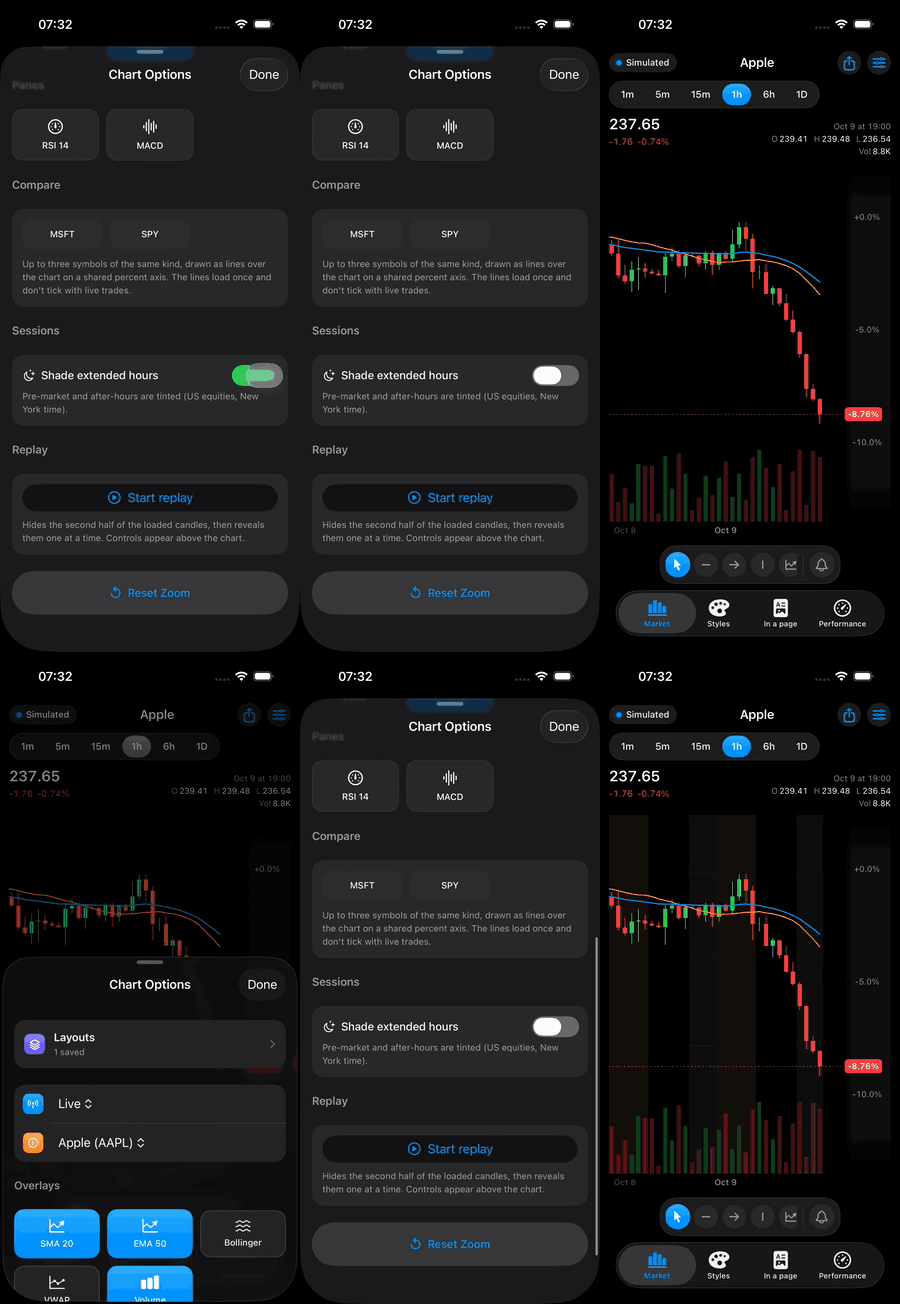
In the Demo, pick AAPL, MSFT or SPY (simulated, 04:00–20:00 New York, weekdays) and use Chart Options → Sessions.